Williams
% Range
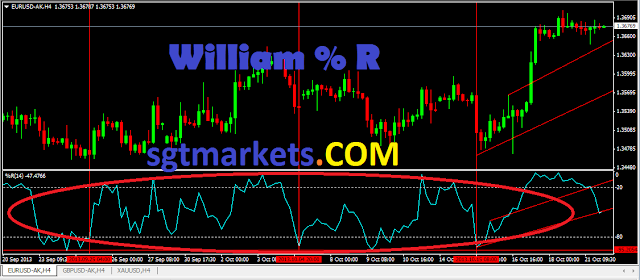
This indicator was created by Larry Williams in order to indicate the oversold and overbought levels. The indicator is very similar to stochastic %K – except that Williams %R is plotted using negative values ranging from 0 to -100. Overbought and Oversold levels are normally set at -20 and -80. The basic signal of buy or sell stop is when Williams % Range falls below the oversold line (buy stop) or overbought (sell stop).
Trading instruments usually retrace the previous day’s trades. The most popular retracement is the Fibonacci Retracement indicator which is a chart tool used to determine the support and resistance levels of an instrument.
How
to Draw Fibonacci Retracement in Forex?

The most popular retracement is the Fibonacci Retracement indicator which is a chart tool used to determine the support and resistance.
The Fibonacci Retracement levels are created by drawing a trend line between two extreme points and then splitting the vertical distance according to the specified percentages.The Fibonacci Retracement can include up to 13 lines. In order to find these retracement levels, you need to identify the recent Swing Highs and Swing Lows (extreme changes in the trend direction).


No comments:
Post a Comment